Quantization - Diagnosing layer sensitivity during post training quantization
Published
By Daniel Ödman
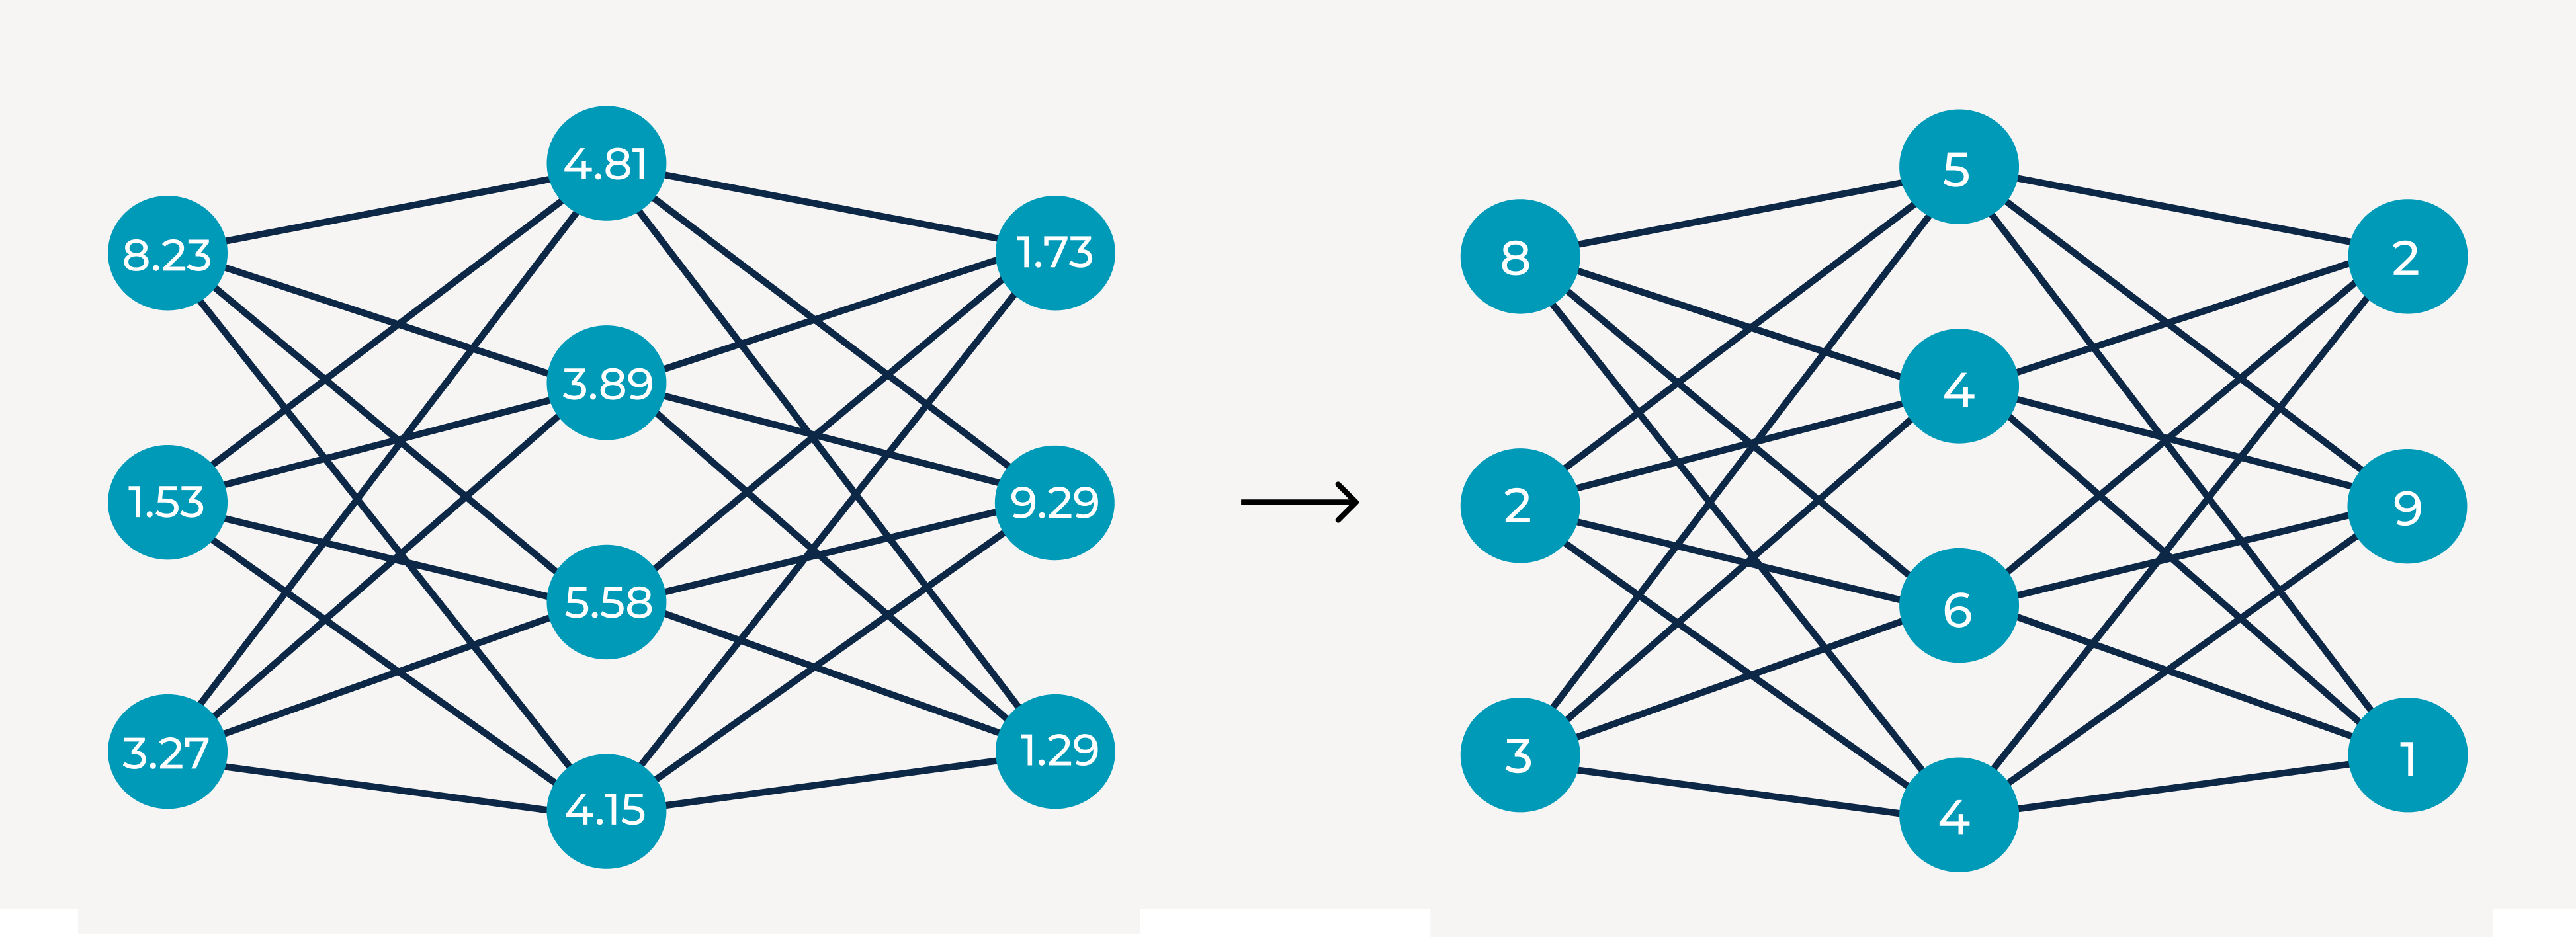
Quantization is an essential optimization technique to adapt a model to edge devices, realizing the hardware’s full potential. In practice, quantization refers to converting high-precision numerical types to lower-precision formats for both weights and activations. Most commonly, quantization converts 32-bit floating point (float32) to int8, often applied using post-training quantization (PTQ) where the model is quantized after training without requiring retraining. The result is a smaller and faster model on-device by cutting memory traffic up to 4× and enabling specialized int8 vector/NPU instructions with lower compute latency.
However, quantization decreases the model’s expressivity and can introduce errors in the computations performed during inference. This performance degradation is expected and almost inevitable, but its impact varies by model architecture and task, ranging from unnoticeable to completely breaking the model. Therefore, this model degradation must be identified and measured as early as possible in the development and deployment pipeline.
In this blog post, we explain how to measure the degradation in practice and introduce a diagnostic toolset based on layer-wise peak signal-to-noise ratio (PSNR).
How to measure quality degradation for quantized models
Several methods exist in practice and academic literature to estimate accuracy degradation after quantization. Even without accessing the complete, annotated dataset and a task-specific evaluation pipeline, you can still strongly indicate the degradation level by comparing intermediate tensors and outputs from the float (float32) and quantized (int8) graphs. You can conclude by investigating the model data stream before and after quantization.
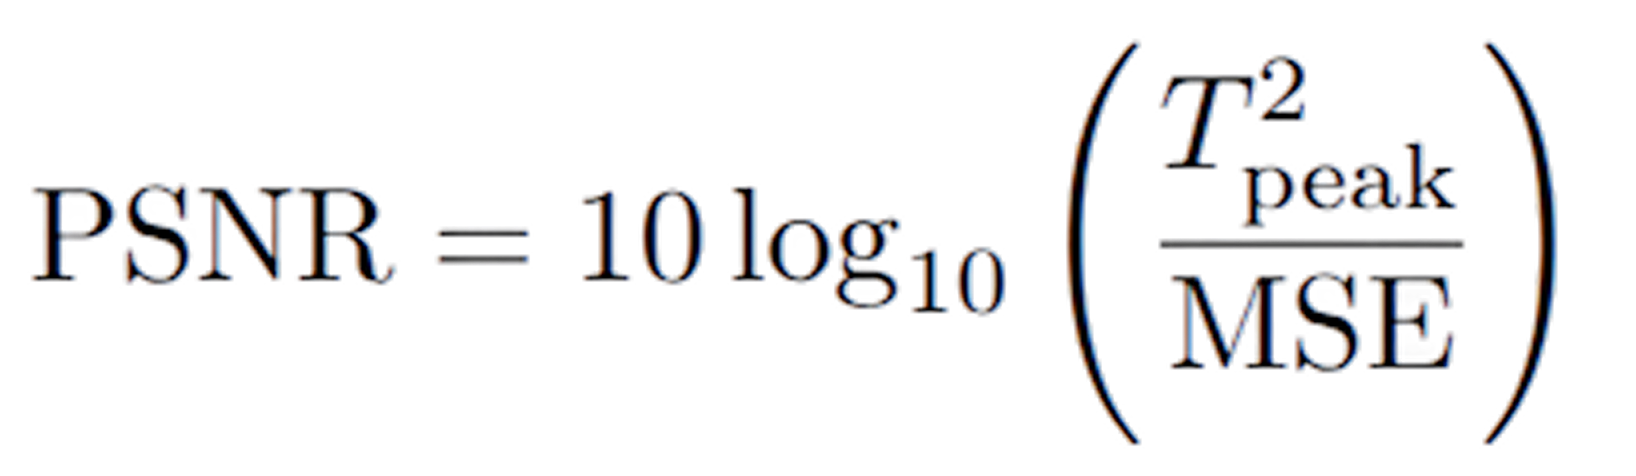
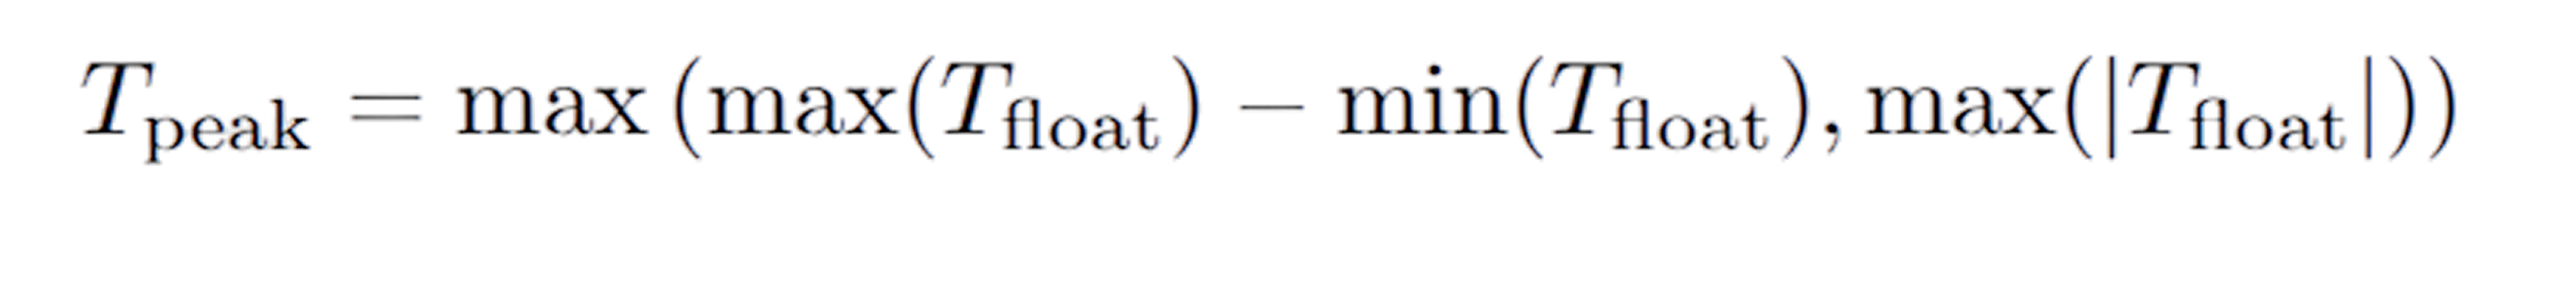
One metric that quantifies the difference between the original data stream and the quantized stream is “peak signal-to-noise ratio”, or PSNR for short. It captures how much a quantized tensor deviates from its original float counterpart, based on the mean squared error (MSE) between them. At Embedl Hub we calculate PSNR using the following formula:

Model output
Measuring PSNR on the model outputs, such as logits, is common and lightweight. A higher PSNR indicates closer alignment between the quantized and unquantized outputs, and values above 30 dB are generally considered sufficient for many use cases, such as image classification. However, tasks like regression, audio, or safety-critical systems may require higher PSNR (≥40 dB) to preserve numerical accuracy.
However, output-level PSNR only captures the performance degradation of the model in its entirety after quantization. It doesn’t tell you where in the network the degradation occurs or why performance dropped more than expected after deployment. Instead, you need to go layer by layer to reach that level of detail. Understanding where degradation occurs makes it possible to debug quantization artifacts, tune calibration, or decide which operations to keep in float.
Diagnosing layers with Embedl hub
Embedl Hub computes PSNR for each layer output in the entire neural network. This lets you visualize how quantization error accumulates through the model and spot sudden drops that point to sensitive layers.


You should expect a steady degradation as you go deeper into the network. This is because the quantization errors introduced in the first layers accumulate and propagate through the downstream layers. For this reason, the error can become significantly worse in particularly deep networks (e.g., Transformers, RNNs), which may require special measures such as mixed-precision.
However, if a sudden drop in PSNR occurs at a specific point in the network, it strongly indicates that a particular layer or operation is sensitive to quantization. This typically happens when the quantization error exceeds the operation’s numerical tolerance, causing a local breakdown in representation. Such layers require extra care to be quantized appropriately, for example, finer calibration, per-channel quantization, or being excluded from quantization altogether.
Here is an example from quantizing EfficientNet-B7, a rather deep CNN, where the PSNR degrades substantially inside the squeeze-and-excite blocks of the network.


An example of a sensitive layer is the softmax layer, which relies on precise value distributions due to its exponential and normalization behavior. Even minor rounding errors in softmax amplify and lead to disproportionate shifts in output and degraded model performance. It is recommended to keep softmax layers at a higher precision (float16/float32) during quantization if possible.
Get started today
Both output and layerwise PSNR are automatically calculated when you run a quantization job with the Embedl Hub Python library:
embedl-hub quantize \ --model my_model.onnxThe PSNR values are computed by comparing the outputs of the original (unquantized) ONNX model to those of the quantized model, layer by layer as well as for the final output. This provides a clear, quantitative measure of how much information is lost at each stage of the network due to quantization.
Follow our getting started guides and start quantizing today!